Tracking Competitor Employee Growth and Attrition From LinkedIn Data
Learn which competitor moves matter by tracking headcount shifts, not snapshots.

A single headcount number from LinkedIn tells a competitive intelligence team almost nothing. The real signal is the change over time, not the count at any one moment, and this article explains why that distinction matters and how to build something around it.
A Single LinkedIn Employee Count Tells You Almost Nothing About a Competitor
Picture a competitor with roughly 500 employees last quarter and roughly 560 this quarter. On its own, "560" says nothing. It's a number floating in space, with no quarter-ago comparison, no breakdown of which teams grew, and no sense of what was happening in the market when those hires landed. Now add one detail: most of those 60 new roles are in sales. Suddenly you're not looking at a company that got bigger. You're looking at a company that decided to go sell something, hard, probably soon.
That's the whole argument in miniature. The number alone is noise. The delta, paired with where the growth happened, is a strategic signal. A competitor adding headcount in engineering is placing a product bet. A competitor adding headcount in sales is placing a go-to-market bet. Same raw number, two completely different stories: watching the trend instead of squinting at a snapshot is what gets you the right one.
Headcount change, not headcount level, is the variable worth tracking. Size tells you how big a company is today. Change tells you what it's betting on tomorrow. Everything the rest of this piece covers, the data sources, the legal guardrails, the pipeline, the AI layer, exists to serve that one shift in attention: from counting heads to watching where the headcount moves.
LinkedIn's Public and Licensed Data Layers
Before anyone builds a tracking system, it helps to know what LinkedIn actually publishes and through which door it comes out. There are at least two distinct layers here, and mixing them up is the fastest way to produce a comparison that looks precise and means nothing.
The first layer is the public company page. The headcount figure sitting on a company's LinkedIn page is self-reported, in the sense that it's built from members who have listed that company as their current employer. It updates on LinkedIn's own cadence, and it's easy enough to pull. It's a reflection of who bothered to update their profile, which is a different thing than a payroll record, not a verified census of the actual workforce. Treated as a trend line, tracked consistently over time, it's genuinely useful. Treated as a precise employee count to be compared head-to-head against a different data source, it will mislead you.
The second layer is licensed data backed by LinkedIn's Economic Graph, which publishes monthly Workforce Reports covering hiring trends, skills gaps, and migration patterns. This is a macro layer. It won't tell you what one specific competitor is doing, but it gives you the backdrop: whether hiring across an industry or region is accelerating or cooling, which makes it possible to tell whether a competitor's move is company-specific or just riding a wider wave.
The mistake to avoid sits between these two layers. A data provider modeling workforce size and LinkedIn's own self-reported member count are measuring two different populations. Adding them together, or comparing them directly as if they were the same metric, produces a number that looks like data but is actually a methodology collision. Each figure needs to be read inside its own frame, one quarter against the same source's prior quarter, not stitched together with a figure from somewhere else.
What Headcount Changes Signal
Once the trend is isolated, the next job is reading it correctly, and that reading has to happen function by function, not at the aggregate level.
Engineering headcount climbing points to a product investment cycle. Sales headcount climbing points to market expansion or a push into a new segment. Those are different bets, and lumping them into one "headcount up" data point erases the distinction that actually matters. There's a subtler signal too: the recruiter-to-headcount ratio. If a company's recruiting staff shrinks relative to its total headcount, that's a sign hiring ambition for the next couple of quarters has already been scaled back, even before the overall headcount shows any decline. It's a forward-looking number. A large workforce with very few active recruiters has effectively paused its growth plan, whether or not anyone there has said so publicly.
Attrition adds a layer that a simple net change wipes out entirely. Net headcount can hold steady while a company quietly loses its most senior technical staff, and the roles and skills walking out the door matter as much as the overall count. Losing ten junior analysts and losing ten senior architects produce the same "minus ten" on a spreadsheet and completely different strategic realities underneath it.
The productivity-move-versus-survival-move distinction makes all of this concrete. A company that cuts headcount after four straight quarters of accelerating revenue is tightening operations, probably because automation or restructuring let it do more with fewer people. A team that reads the bare headcount drop without checking the revenue trend will take the tightening for a company in trouble, getting the story backwards once revenue is factored in. That gap, between what the number looks like and what it actually means once revenue is layered in, is the entire reason context has to travel with every headcount figure a team pulls. Skipping the context turns the analysis into guessing with extra steps.
The legal and terms-of-service constraints that shape any collection pipeline
Before sketching out how to build a tracking system, the biggest obstacle standing in the way isn't a technical one: it's contractual.
Using bots or automated methods to access LinkedIn, copy profiles, or harvest data without express written permission breaches the user agreement that every account holder has already accepted. No vendor, no tool, no clever proxy setup changes that exposure. The contract was signed at account creation, and it applies regardless of how the scraping gets dressed up.
The legal track record on this is more nuanced than "scraping is illegal. Computer Fraud and Abuse Act claims against scrapers have generally failed in court when the data being pulled was publicly accessible. Terms of Service claims, though, can succeed. That means breach-of-contract exposure is real even when the data itself is public and the CFAA doesn't apply, and the outcome depends heavily on whether the scraper agreed to the site's terms and how those terms are written. The cases of ProAPIs and Netswift stand as the most recent enforcement data points in this line of litigation.
GDPR raises the stakes further for anyone operating in or serving European markets. Public availability is not a defense under GDPR. Regulatory fines can reach up to 4% of global annual revenue, making a data collection shortcut a board-level risk.
None of this means competitor headcount tracking is off the table. It means the method matters as much as the data. Practitioners need to route collection through compliant channels rather than direct automated access to LinkedIn itself, and that redirect is exactly what the next section builds out.
Building a compliant headcount tracking pipeline: sources, cadence, architecture
A pipeline built the right way routes around direct automated LinkedIn access entirely, combining compliant data products, job-posting feeds, and web monitoring into a layered system that still captures the same signals, just through defensible means.
Start with the data source layer. LinkedIn's own Economic Graph publishes monthly hiring data, and pulling from that gives a macro baseline for free, without any scraping exposure at all. Layer job-posting feeds on top of that. Postings change daily, and the volume, function mix, and seniority level of a competitor's open roles are a leading indicator that appears weeks before a monthly headcount snapshot would catch the same shift.
Cadence should match how fast each signal actually moves. Headcount changes slowly, so monthly snapshots are the right rhythm. Collecting more often adds cost without adding proportionally more signal, and monthly data supports clean quarter-over-quarter comparisons, which is the unit competitive intelligence actually runs on. Job postings move faster, so daily or weekly collection fits better there, catching role-level demand and recruiter headcount shifts closer to the moment they happen.
The architecture itself needs three pieces working together. Structured storage holds each snapshot, headcount by function, active postings by department, recruiter count, in a time-series format, because without that structure no trend can be computed later. Web monitoring covers the qualitative side: press releases, blog posts, and LinkedIn posts from the company account, catching a hiring freeze announcement or a new office opening that a numeric feed would never capture. Webhook-based delivery ties it together, pushing new information to Slack, a CRM, or an AI agent the moment a change is detected.
Structuring the collected data so it produces trend analysis
Snapshots stored without a consistent schema create the same problem as a single headcount number: no trend can be computed from data that wasn't designed to hold one.
Every record in the store should carry a company identifier, a snapshot date, the total headcount figure, headcount broken out by function (engineering, sales, marketing, operations, recruiting), active job posting counts by function, and a source identifier, so the methodology behind any given figure can always be traced back. Recruiter headcount and the recruiter-to-total ratio belong in the schema from the start, computed at the moment data comes in, rather than calculated later against records that may not have been collected consistently. That ratio is a leading indicator, and leading indicators lose their value fast if the historical data behind them is shaky.
A few derived metrics should live in the store itself rather than get recalculated by hand every time someone needs them. Quarter-over-quarter headcount growth by function is one. Hiring velocity, meaning new roles opened per month, is another, and it works as a forward-looking complement to net headcount change. Where the data supports it, tracking which skills are lost to attrition adds a third layer: the capabilities walking out of a competitor's workforce are often the clearest window into where their gaps actually are. A schema built around those fields turns a folder of dated CSVs into something that answers "what's changing and where" without anyone doing manual math every time a new snapshot lands.
Feeding the structured data into an AI layer for actionable summaries
Clean, structured data is what makes AI-based interpretation trustworthy in the first place. A model reasoning over consistent JSON time-series records produces coherent, checkable analysis. A model handed raw HTML snapshots produces something closer to a guess dressed up in confident language.
Once the data is clean, the AI layer earns its keep in a few specific ways. It can detect meaningful changes on its own, an engineering headcount spike at a competitor, a simultaneous drop in recruiting activity, an attrition pattern piling up in one function, and turn that into a plain-language summary without an analyst having to manually dig through rows of numbers. It can contextualize those changes against macro data, cross-referencing a competitor's hiring slowdown with the Economic Graph's monthly hiring figures to tell whether the slowdown is specific to that company or just the whole industry cooling off together. And it can generate alerts tied to specific thresholds, so when recruiter headcount drops below a defined ratio, or a new function shows up in job postings for the first time, a webhook fires a structured summary straight to Slack, a CRM, or an AI agent mid-task.
The webhook delivering structured summaries straight to an AI agent mid-task means the agent can pull competitive intelligence context at the exact moment it's relevant, rather than waiting on a human to open a dashboard, closing the gap between collecting data and acting on it. An agent relying on whatever competitive information sits in its training data is working with information that's stale at best and invented at worst. Wiring that same agent into a live, structured feed fixes the problem at the source, swapping a guess for a number that was collected last month and means something.
Reading the output: what the trends reveal about strategic intent
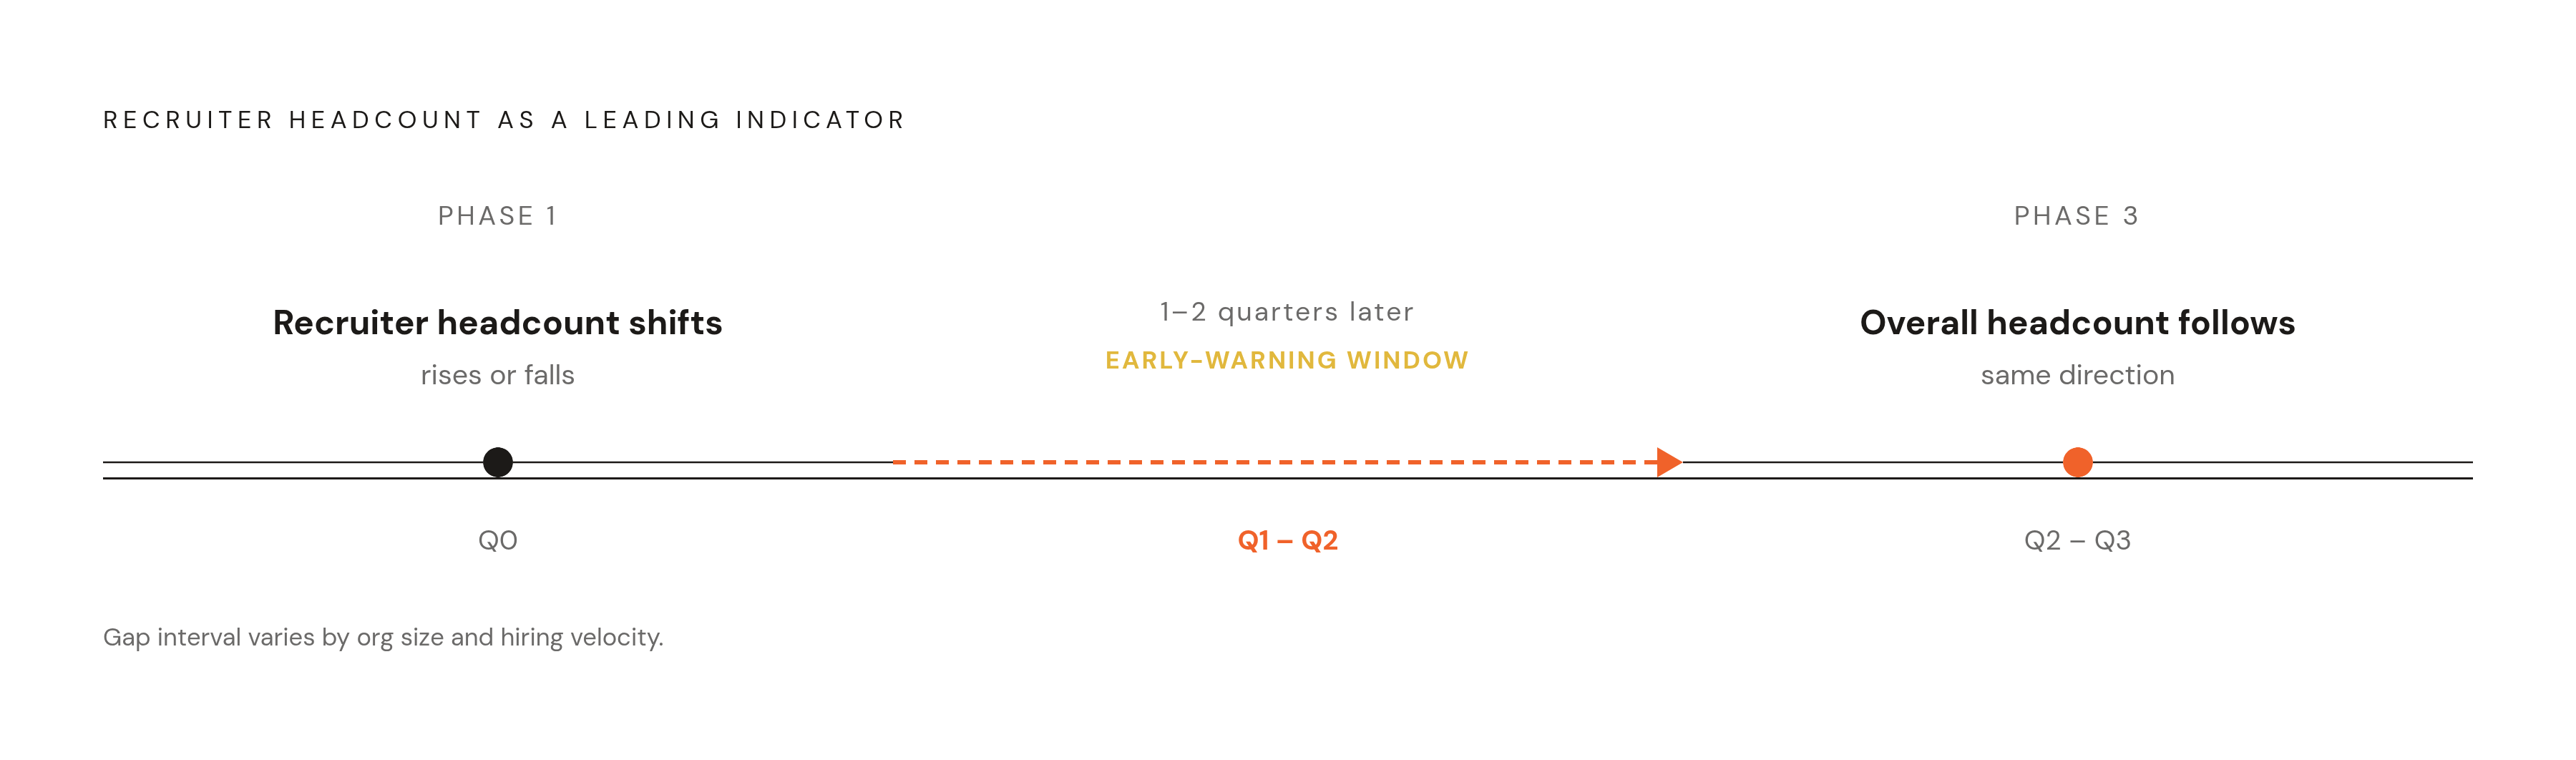
The clearest pattern in a working pipeline is recruiter headcount growth that appears one to two quarters before general headcount follows. That lag is a leading indicator of a scaling event, catching the move before it ever shows up in the aggregate count, and it's the single most useful early-warning signal the whole system produces. Sustained engineering growth paired with flat sales headcount signals a competitor in product investment mode, likely gearing up for a release cycle, a cue to watch their product roadmap closely. A headcount decline concentrated in one function could mean a strategic pivot or a capability getting outsourced rather than organizational distress, and checking job postings for backfilling elsewhere is usually enough to tell which it is. High attrition among senior technical staff deserves particular attention, because the skills most likely to walk out the door are usually the ones most worth keeping, so a competitor losing senior engineers is picking up a strategic vulnerability, not just a lower headcount number.
Internal mobility is becoming a primary growth path at leading employers, so headcount growth isn't the only marker of organizational health anymore. Retention and internal movement matter just as much: a competitor that looks flat on headcount could be quietly reshuffling talent internally in ways that never register as a hire or a departure.
None of these patterns should move into a strategic decision on their own. Every meaningful headcount signal deserves a cross-check against at least one non-headcount source, job postings, a press release, a product announcement, before it gets treated as fact. The pipeline, however well built, produces hypotheses. Turning those hypotheses into decisions is still a human job, and that's exactly where the discipline has to hold.