Benchmarking Managed Scraping APIs for Anti-Bot Targets
Real performance gaps emerge only when you test against actual anti-bot defenses.
How modern anti-bot systems detect scrapers in 2026
A single "success rate" on a benchmark chart tells you almost nothing on its own. Beating a basic Cloudflare challenge and beating a retail site locked down by DataDome are two different sports wearing the same jersey. Before trusting any percentage, find out what got tested, against what kind of target, and under how much load, because that context is the whole story.
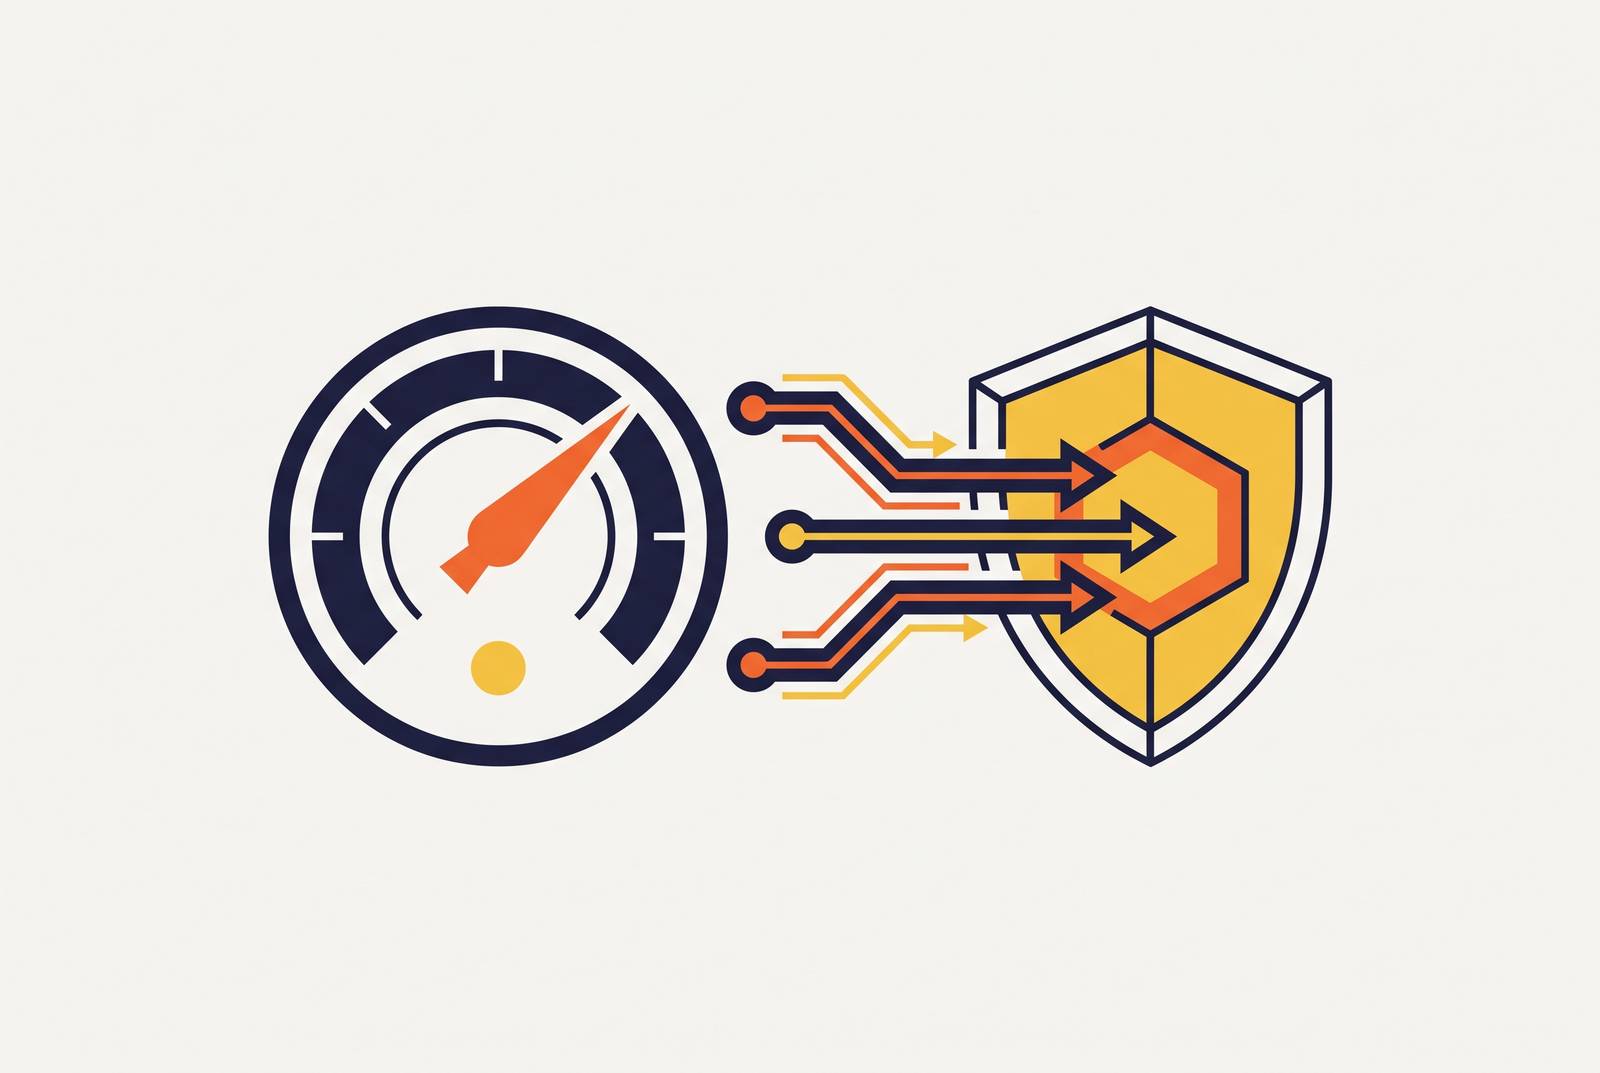
Four companies run most of the commercial anti-bot market: DataDome, Cloudflare Bot Management, Akamai Bot Manager, and HUMAN Security. None of them flip a simple yes-or-no switch on your traffic. They build a trust score out of multiple signal groups, and a scraper has to survive all of them, not just dodge one.
Network signals come first: IP reputation, ASN type (residential IP or a known data center block), request frequency, and TLS fingerprinting via JA3/JA4. Most scrapers never think about this layer, and that's exactly the problem. A Python script can spoof a Chrome User-Agent string all day long, but that spoofing produces a TLS handshake that looks nothing like a real Chrome handshake, since the two operate at completely different layers. Every major vendor catches that mismatch instantly, before the page even renders. The client never gets to make its case.
Past the network layer sits the browser environment: canvas and WebGL fingerprints, AudioContext quirks, the navigator.webdriver flag, font lists, leakage from automation-protocol activity. Then comes behavior, mouse movement, timing rhythm, whether the navigation path looks like a human wandering or a script marching in a straight line, whether the visitor touched a honeypot element only a bot would click. Challenge-response mechanisms (JavaScript puzzles, proof-of-work, CAPTCHAs) are triggered near the end of the chain by a low trust score rather than served up front. Reputation and correlation systems tie the whole thing together across sessions and sites, building a picture of suspicious patterns over time.
Each vendor picks its own chokepoint, and those differences determine which requests get blocked, challenged, or logged. Cloudflare leans on JA4 fingerprinting and managed challenges at the edge, scoring traffic across a range of thresholds for block, challenge, or log. Akamai goes deeper, validating sensor data well past the TLS handshake, and it guards the sectors with the most money on the line: financial services, travel, big e-commerce. Consistently climbing that wall is one of the harder jobs in the business. DataDome runs ML-first rather than fingerprint-first, with more than 85,000 customer-specific models. Every protected site becomes its own puzzle. Crack one, and all you've cracked is one.
Kasada plays by different rules. Its proof-of-work JavaScript challenges cost the client real computation rather than relying on conventional CAPTCHA gates. The result is that DIY bypasses against Kasada in production aren't stable fixes. Rolling your own solution against Kasada in production isn't a stable fix, it's a countdown timer.
None of this happens in a vacuum. Automated traffic crossed 53% of all web traffic in 2025, up from 51% the year before, and most sites now treat unrecognized automation as guilty until proven otherwise. The WAF market hit $11 billion in 2025 according to Mordor Intelligence. That's real money chasing scrapers off real estate, and every benchmark below plays out inside that fight.
What the Proxyway 2025 Web Scraping API Report tested and why methodology details change the numbers
Proxyway's 2025 Web Scraping API Report is the most thorough independent benchmark running right now, and the fine print matters as much as the scoreboard. Eleven providers, tested against 15 well-protected, big-brand sites, 6,000 pages pulled total. Two load conditions ran side by side, 2 requests per second and 10 requests per second, scaling to roughly 5 million and 26 million monthly requests.
Providers weren't told which target sites would be used. That one control kills any option to pre-tune a scraper for a known test. Some numbers here land softer than a vendor's own marketing page as a result.
The success definition is what separates this from a sales pitch. A 200 status code counted for nothing by itself. Proxyway checked the actual HTML content, and any response that came back as a challenge screen, even dressed up in a technically successful 200, counted as a failure. That's a harder bar than most scrapers get held to, and it's the right one: a challenge page pretending to be a success is worse than an honest error, because an honest error at least tells you something broke.
What the Proxyway 2025 results show about the top tier: Zyte, Decodo, Oxylabs, and ScrapingBee
Four providers cleared 80% success at 2 req/s: Zyte, Decodo, Oxylabs, and ScrapingBee. Same tier on paper. Pulling apart the speed, cost, and load stability numbers shows the tier splits fast.
Zyte won, and not by a small margin. It hit 93.14% success at 2 req/s and held 85.89% even at 10 req/s, up to 7.3% ahead of the next-best vendor by Proxyway's own math. It also posted the fastest average response time among successful requests (11.15 seconds) and the highest sustained throughput in the entire test (15,422 results per hour). Proxyway called it out by name for doing "an amazing job at unblocking tough websites," naming it best overall across two reports in the same year. Pricing scales with difficulty rather than sitting flat, so easy sites cost close to nothing and only the genuinely hard ones push the bill up. If the top tier has a clear winner, this is it.
Decodo (what used to be Smartproxy before the rename) landed just behind Zyte on raw success, 87.09% and 85.03% across the two loads. The real story here is stability. Its low-load and high-load figures barely move apart, so it doesn't buckle when volume climbs the way some competitors do. Average response time came in at 15.22 seconds, throughput at 7,403 results per hour. The pitch is flat pricing no matter how hard the target fights back, which matters for a team that wants to set a budget once and stop thinking about it.
Oxylabs posted 85.82% at 2 req/s but dropped to 79.1% at 10 req/s, a steeper fall than Decodo showed under the same pressure. Average response time was 16.76 seconds, throughput 10,174 results per hour. Raw speed isn't the selling point here. The platform around it includes AI-assisted parsing through OxyCopilot, hosted browser endpoints, a structured extraction layer sitting on top of the unblocking engine, and an IP pool spread across 195 countries. It's built for teams that want data transformation and access bundled together, priced flat enough that bigger organizations can plan around it instead of chasing the last few points of throughput.
ScrapingBee cleared the 80% bar too, though the top three above it earn the attention for good reason: they pull ahead on the numbers that actually move a production bill, speed under load and cost you can predict in advance.
Where the mid-tier and bottom-tier providers fit
Below that top cluster, the gap doesn't narrow, it widens into a cliff.
One point-and-shoot provider posted 70.39% at 2 req/s, then collapsed to 31.76% at 10 req/s, the steepest load-driven falloff in the whole benchmark. Its 8,865 results-per-hour figure at 2 req/s looks fine on a spreadsheet until you remember that's the load level where it was already struggling.
A second point-and-shoot competitor handled pressure better, sliding from 68.95% at 2 req/s to 62.2% at 10 req/s, a much gentler curve. It ran 13.92 seconds average response, 6,600 results per hour, and came in cheap. It also pulled off a specific win, succeeding on G2, a target where Proxyway noted that Oxylabs, Decodo, and Zyte's next-tier competitor all failed. That's the whole lesson buried inside these tables. An aggregate score can hide a provider's real edge on one specific protection type.
Two proxy-style products round out the bottom, and both illustrate the same trap: a tool built for one job doesn't automatically do the other. One scored 56.72% at 2 req/s, falling to 42.17% at 10 req/s, fine on lightly defended sites but losing ground fast once the target gets serious. That tracks with what it actually is: a general crawling tool, not something purpose-built for heavily defended commercial targets. The other, built on proxy network infrastructure, scored 53.28% and 43.27% across the two loads, with an 18.55-second average response and just 3,227 results per hour. Its routing is solid, because routing is its heritage. As an anti-bot bypass layer, it landed near the bottom of the field. Judge it as a proxy network and it holds up fine. Judge it as an unblocker and it falls apart.
What the Scrape.do 2026 benchmark adds and where it disagrees with Proxyway
A second benchmark, run for 2026, tested 11 providers against a narrower and much harder set of targets: seven high-difficulty domains, Amazon, Indeed, GitHub, Zillow, Capterra, Google, and X/Twitter. Proxyway went wide across 15 sites of mixed difficulty. Scrape.do went deep on seven of the toughest properties on the internet, and the rankings that fall out barely resemble each other.
The success bar stayed consistent: a 200 status code plus verified HTML content, challenge pages counted as failures, run across hundreds of requests per provider.
One provider posted a 98.87% average across all seven domains, the highest of any provider tested. A second hit 98.61%. A third landed at 97.14% overall, with 100% on six of the seven, with its only shortfall being Amazon. Its one weak spot was Amazon at 80%, which traced back to a specific crawling component rather than any broader platform weakness. That's a fixable bug.
Zyte, the clear number-one in Proxyway's report, posted a strong 91.43% here but landed well down the field in this benchmark. "Best overall" depends entirely on what got tested, full stop. A provider tuned for breadth across 15 mixed-difficulty sites won't automatically top a benchmark built around seven of the most heavily defended properties on the internet, and pretending otherwise is how teams pick the wrong tool for the job in front of them.
Speed told a different story than success rate did. The provider that scored 97.14% averaged 14.2 seconds overall, slower than three competitors in the same test, a gap that traces to per-run startup overhead baked into its architecture. Even inside that one provider's own numbers, speed swung wildly by target: GitHub came back in 6.2 seconds, while Indeed and Capterra dragged to 20.8 and 17.2 seconds. Success rate and speed are two separate report cards. A provider can ace one and barely pass the other.
The hardest targets in the benchmarks and what they reveal about protection tiers
Lining up both benchmarks reveals a pattern immediately: difficulty isn't spread evenly across the internet. Certain sites post the lowest average success rates no matter which provider is doing the scraping, and those sites map almost exactly onto the vendors known for the toughest stacks: heavy machine-learning layers, deep sensor validation, proof-of-work challenges that punish automation with computation instead of just flagging it and moving on.
Two separate benchmarks, two separate teams, two separate methodologies, and the same handful of sites keep landing at the bottom of the table regardless of who's testing. That's the anti-bot market working exactly as designed. The sites spending the most on detection are, unsurprisingly, the hardest to scrape, and no managed API gets to skip that math no matter how well it's built.
The real question when picking a tool is which provider wins against the specific tier of defense sitting in front of whatever site is actually on the list. It's which provider wins against the specific tier of defense sitting in front of whatever site is actually on the list. Amazon, Indeed, and G2 are not the same fight, and a provider that dominates one can stumble badly on another. Match the tool to the target, not to the leaderboard.